Introduction
Microsoft Fabric represents a significant advancement in the data analytics ecosystem, offering a unified platform that brings together various data services. One of the key components of Fabric is the lakehouse, which combines the best features of data lakes and data warehouses. In this blog post, we’ll walk through how to connect to Excel and CSV files stored in your Fabric lakehouse using Power BI. This integration allows you to leverage your existing data assets while harnessing the powerful visualization capabilities of Power BI.
Prerequisites
- Access to a Microsoft Fabric workspace with a lakehouse
- Power BI Desktop installed on your computer
- Excel or CSV files uploaded to your lakehouse
- Proper permissions to access the lakehouse and its contents
For the latest updated information, please refer to the official Microsoft documentation.
Step 1: Open Power BI Desktop
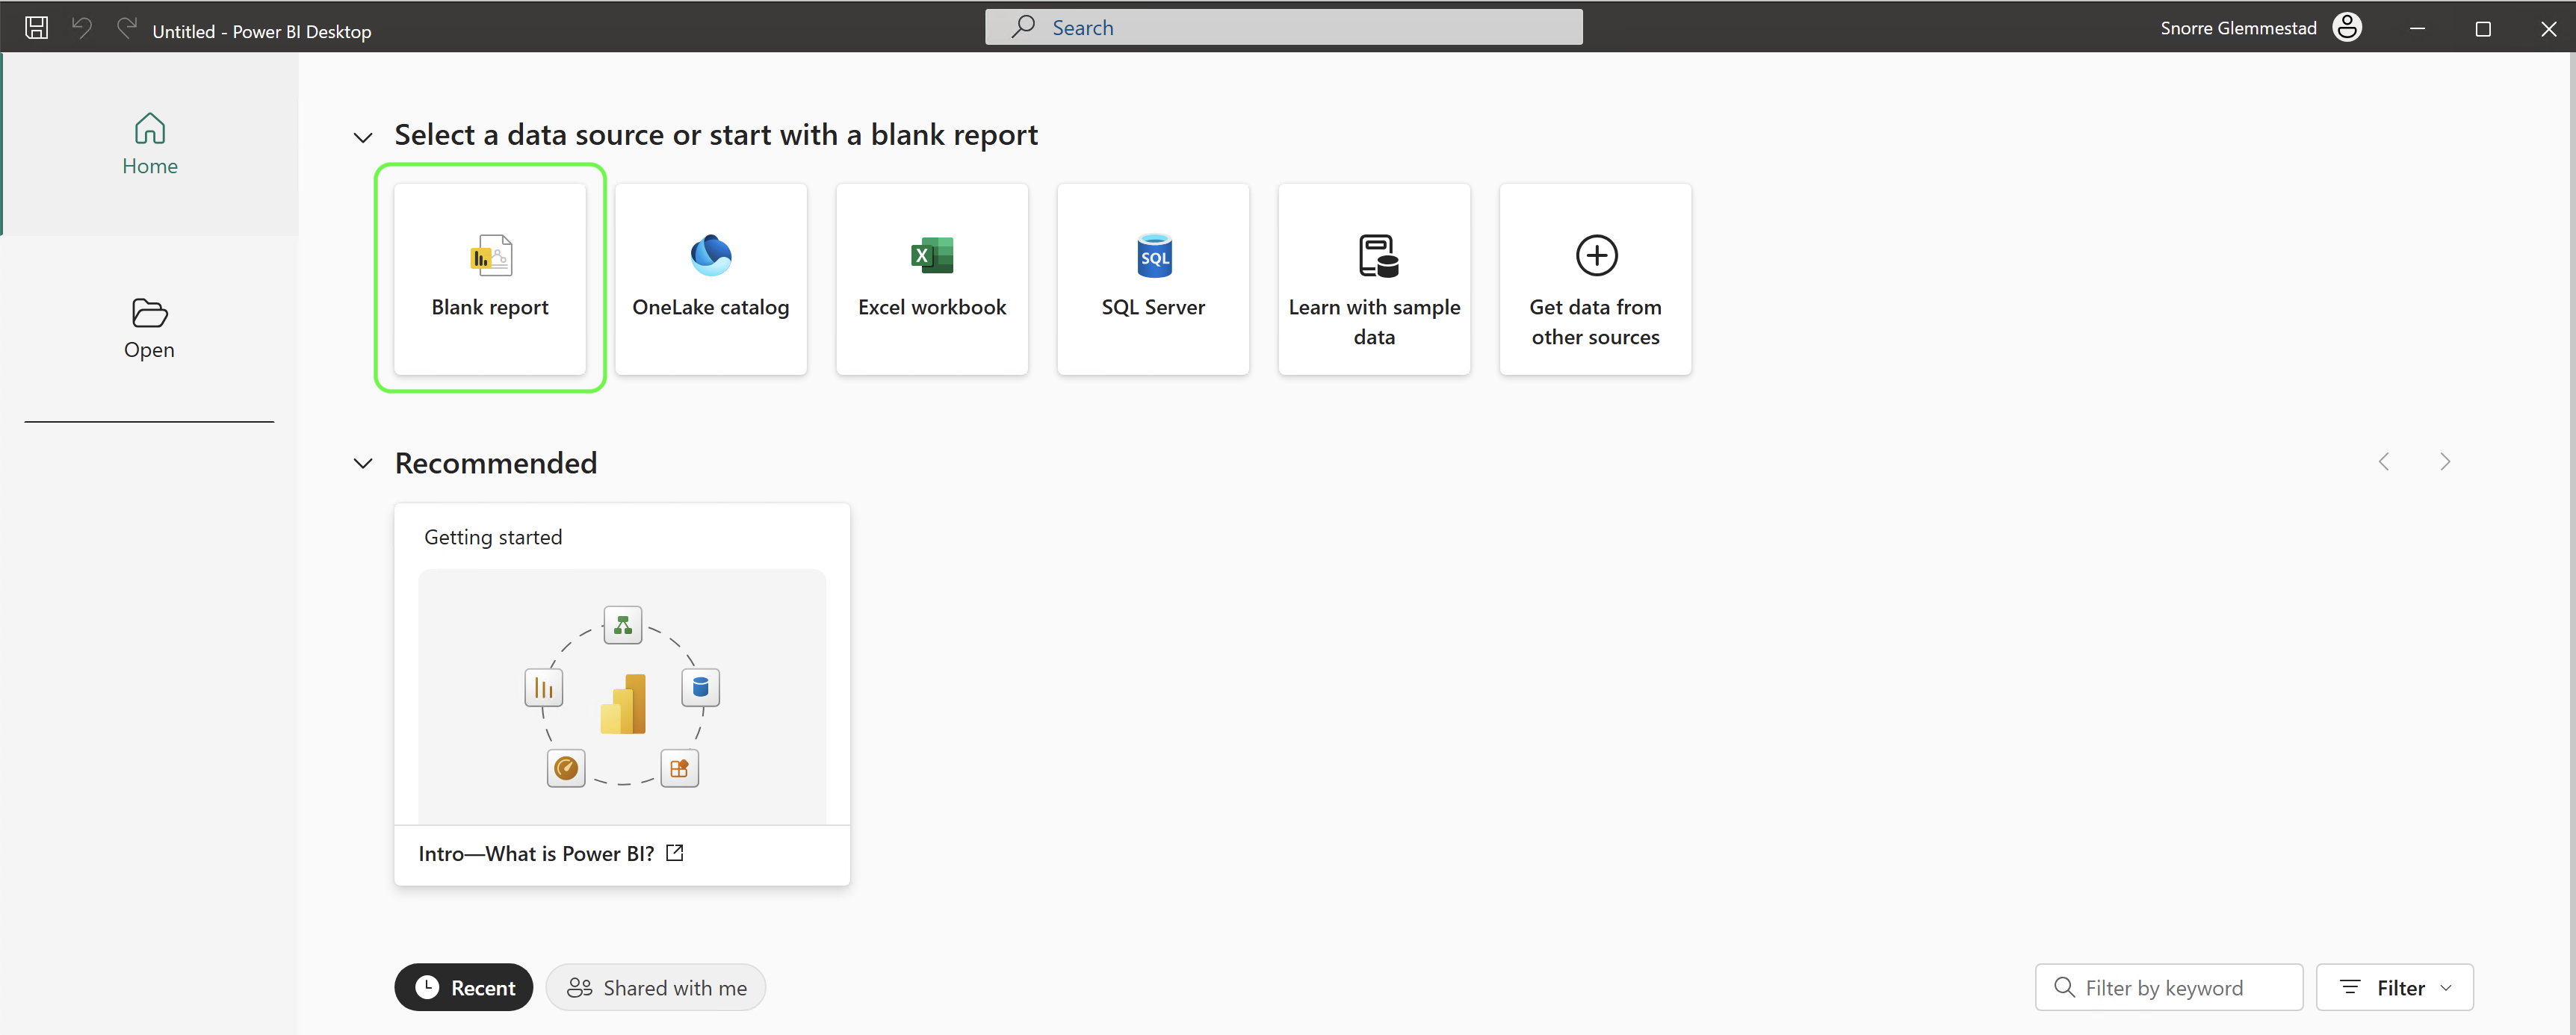
First, launch Power BI Desktop on your computer. You’ll be presented with the start screen where you can choose to open an existing report or create a new one. In this case, we’ll create a new report by selecting “Blank report” from the start options.
Step 2: Start with a Blank Query in Power BI

To connect to your lakehouse data using a Blank query approach, which gives you more control and flexibility:
- In Power BI Desktop, click on the “Get data” button in the Home ribbon.
- From the dropdown menu, navigate to the “More…” option.
- In the Get Data dialog, browse to the “Blank Query” option (you can find it under “Other” category).
- Select “Blank query” and click “Connect” to open the Power Query Editor.
Step 3: Use Power Query to Access Lakehouse Contents with M Code
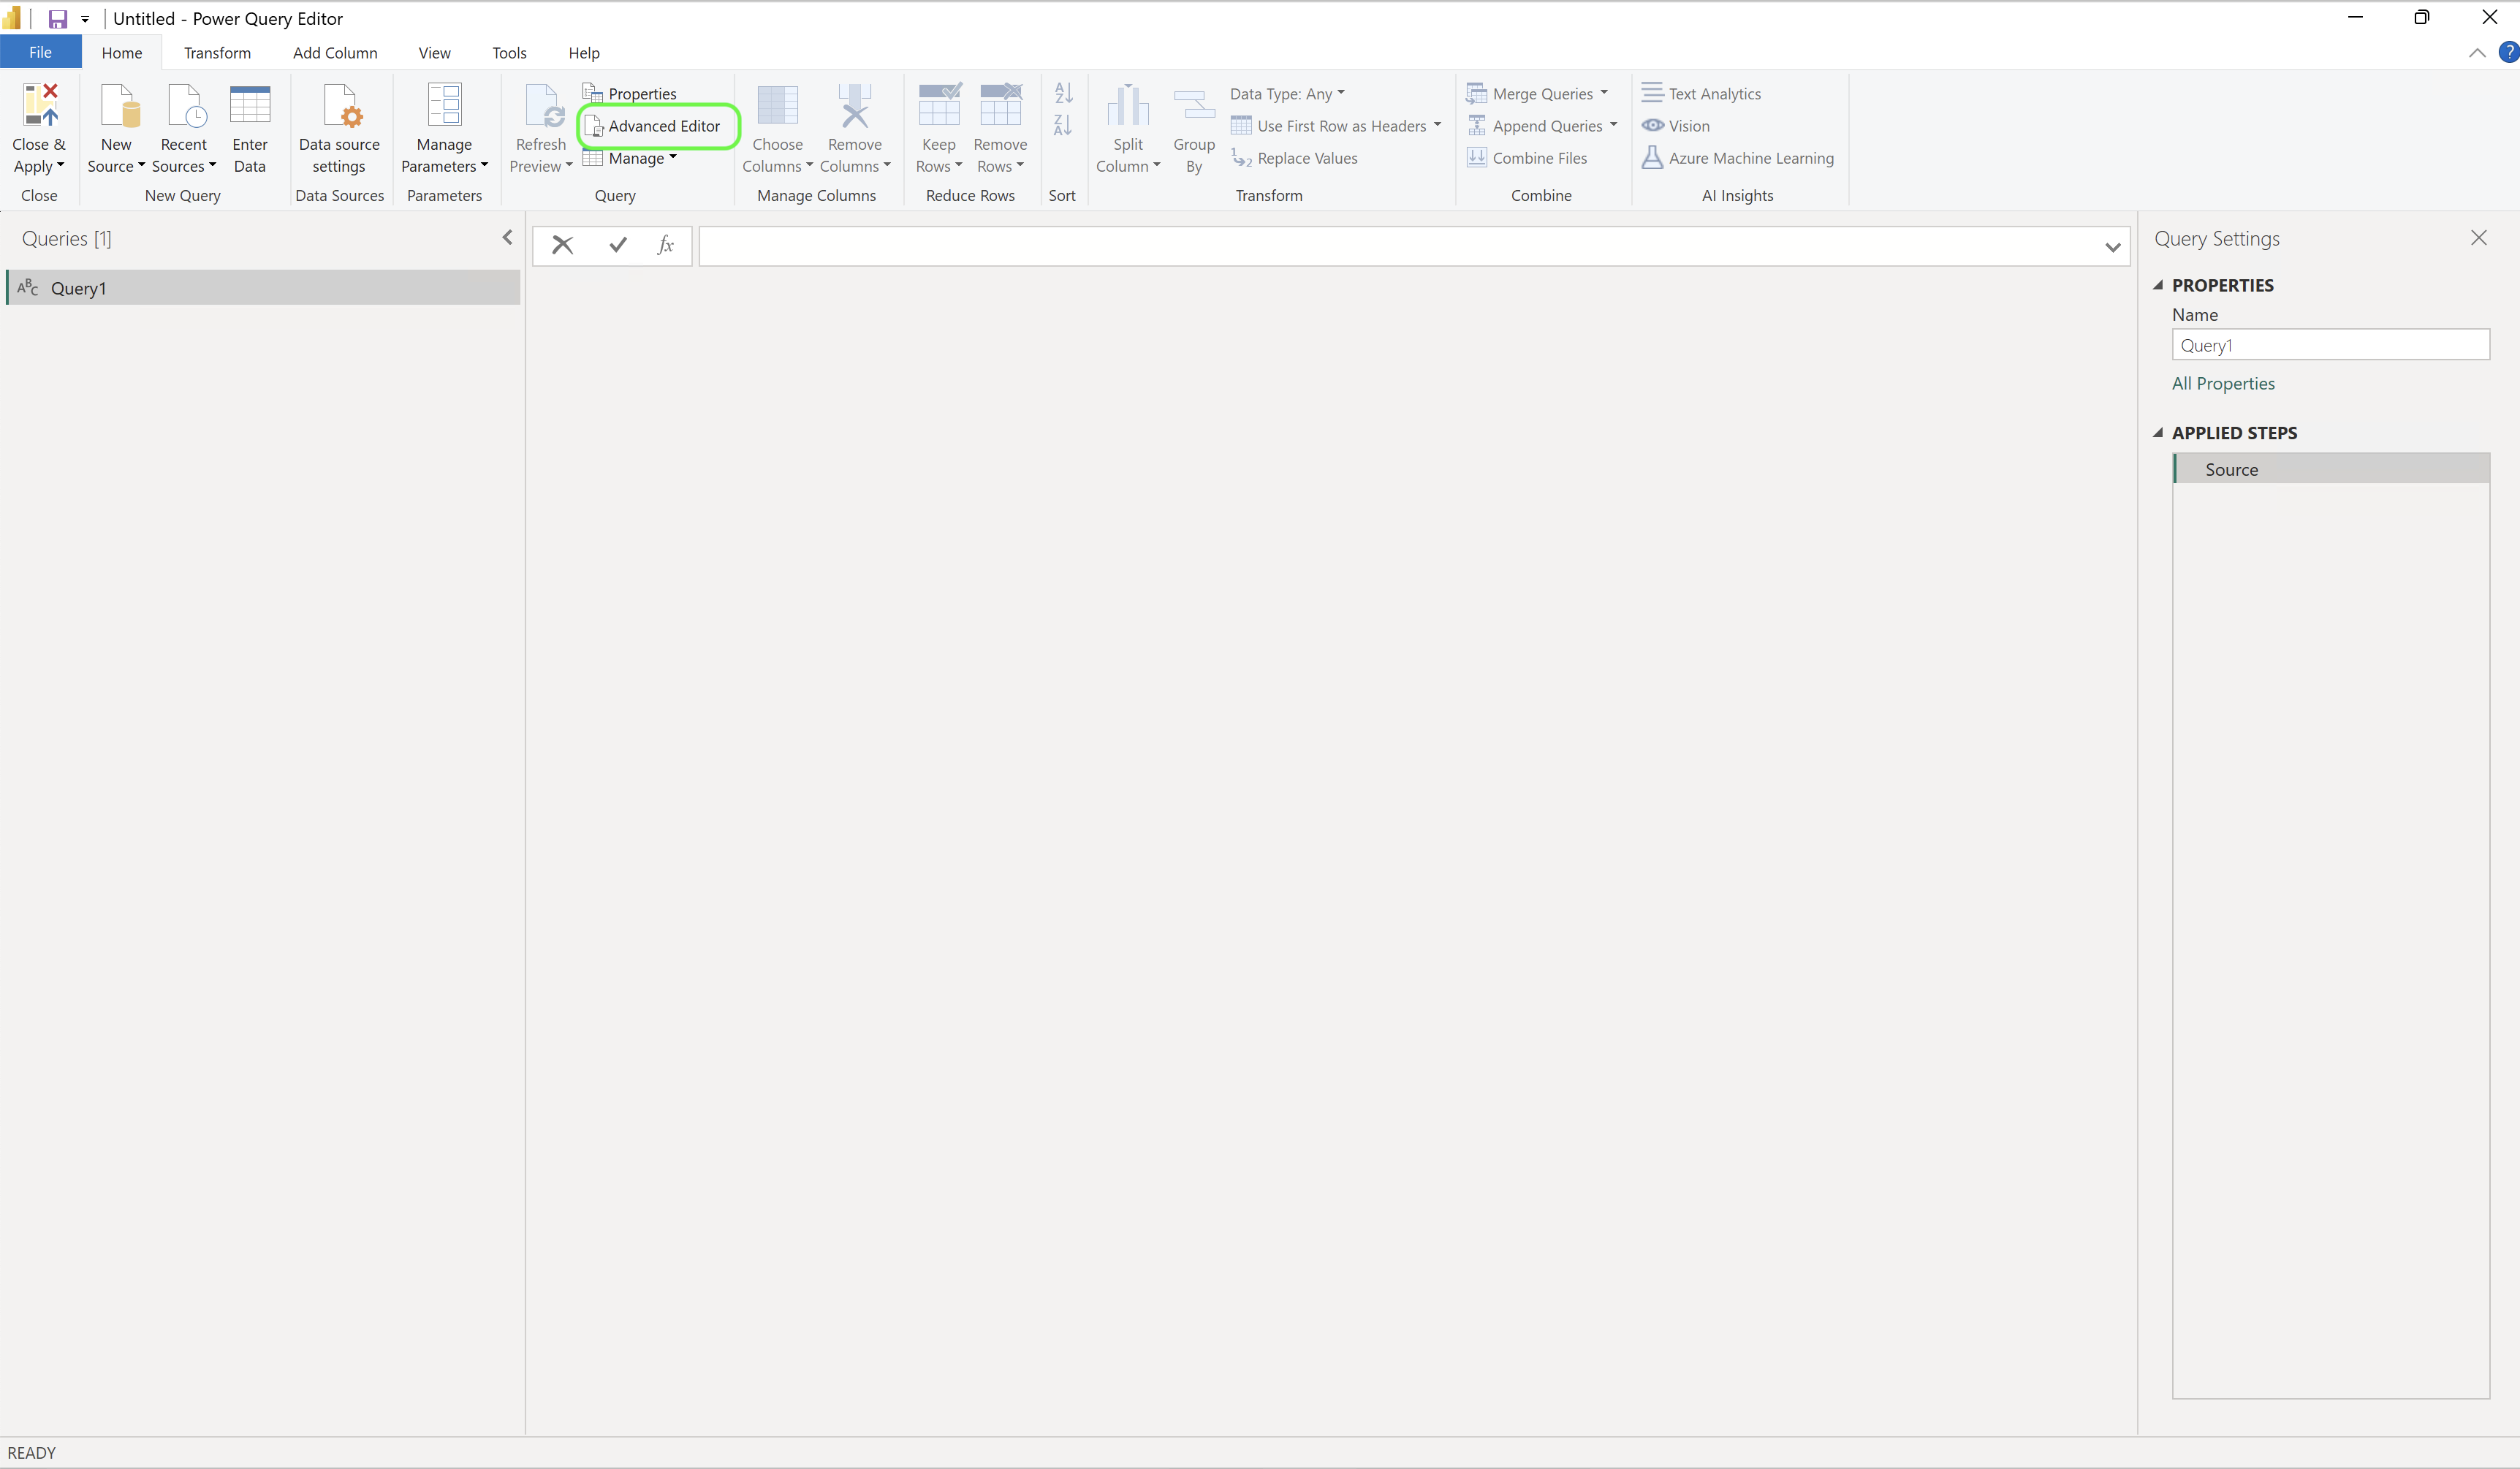
With the Power Query Editor now open:
- Click on “Advanced Editor” in the Query section of the ribbon.
- In the Advanced Editor window, delete any existing code.
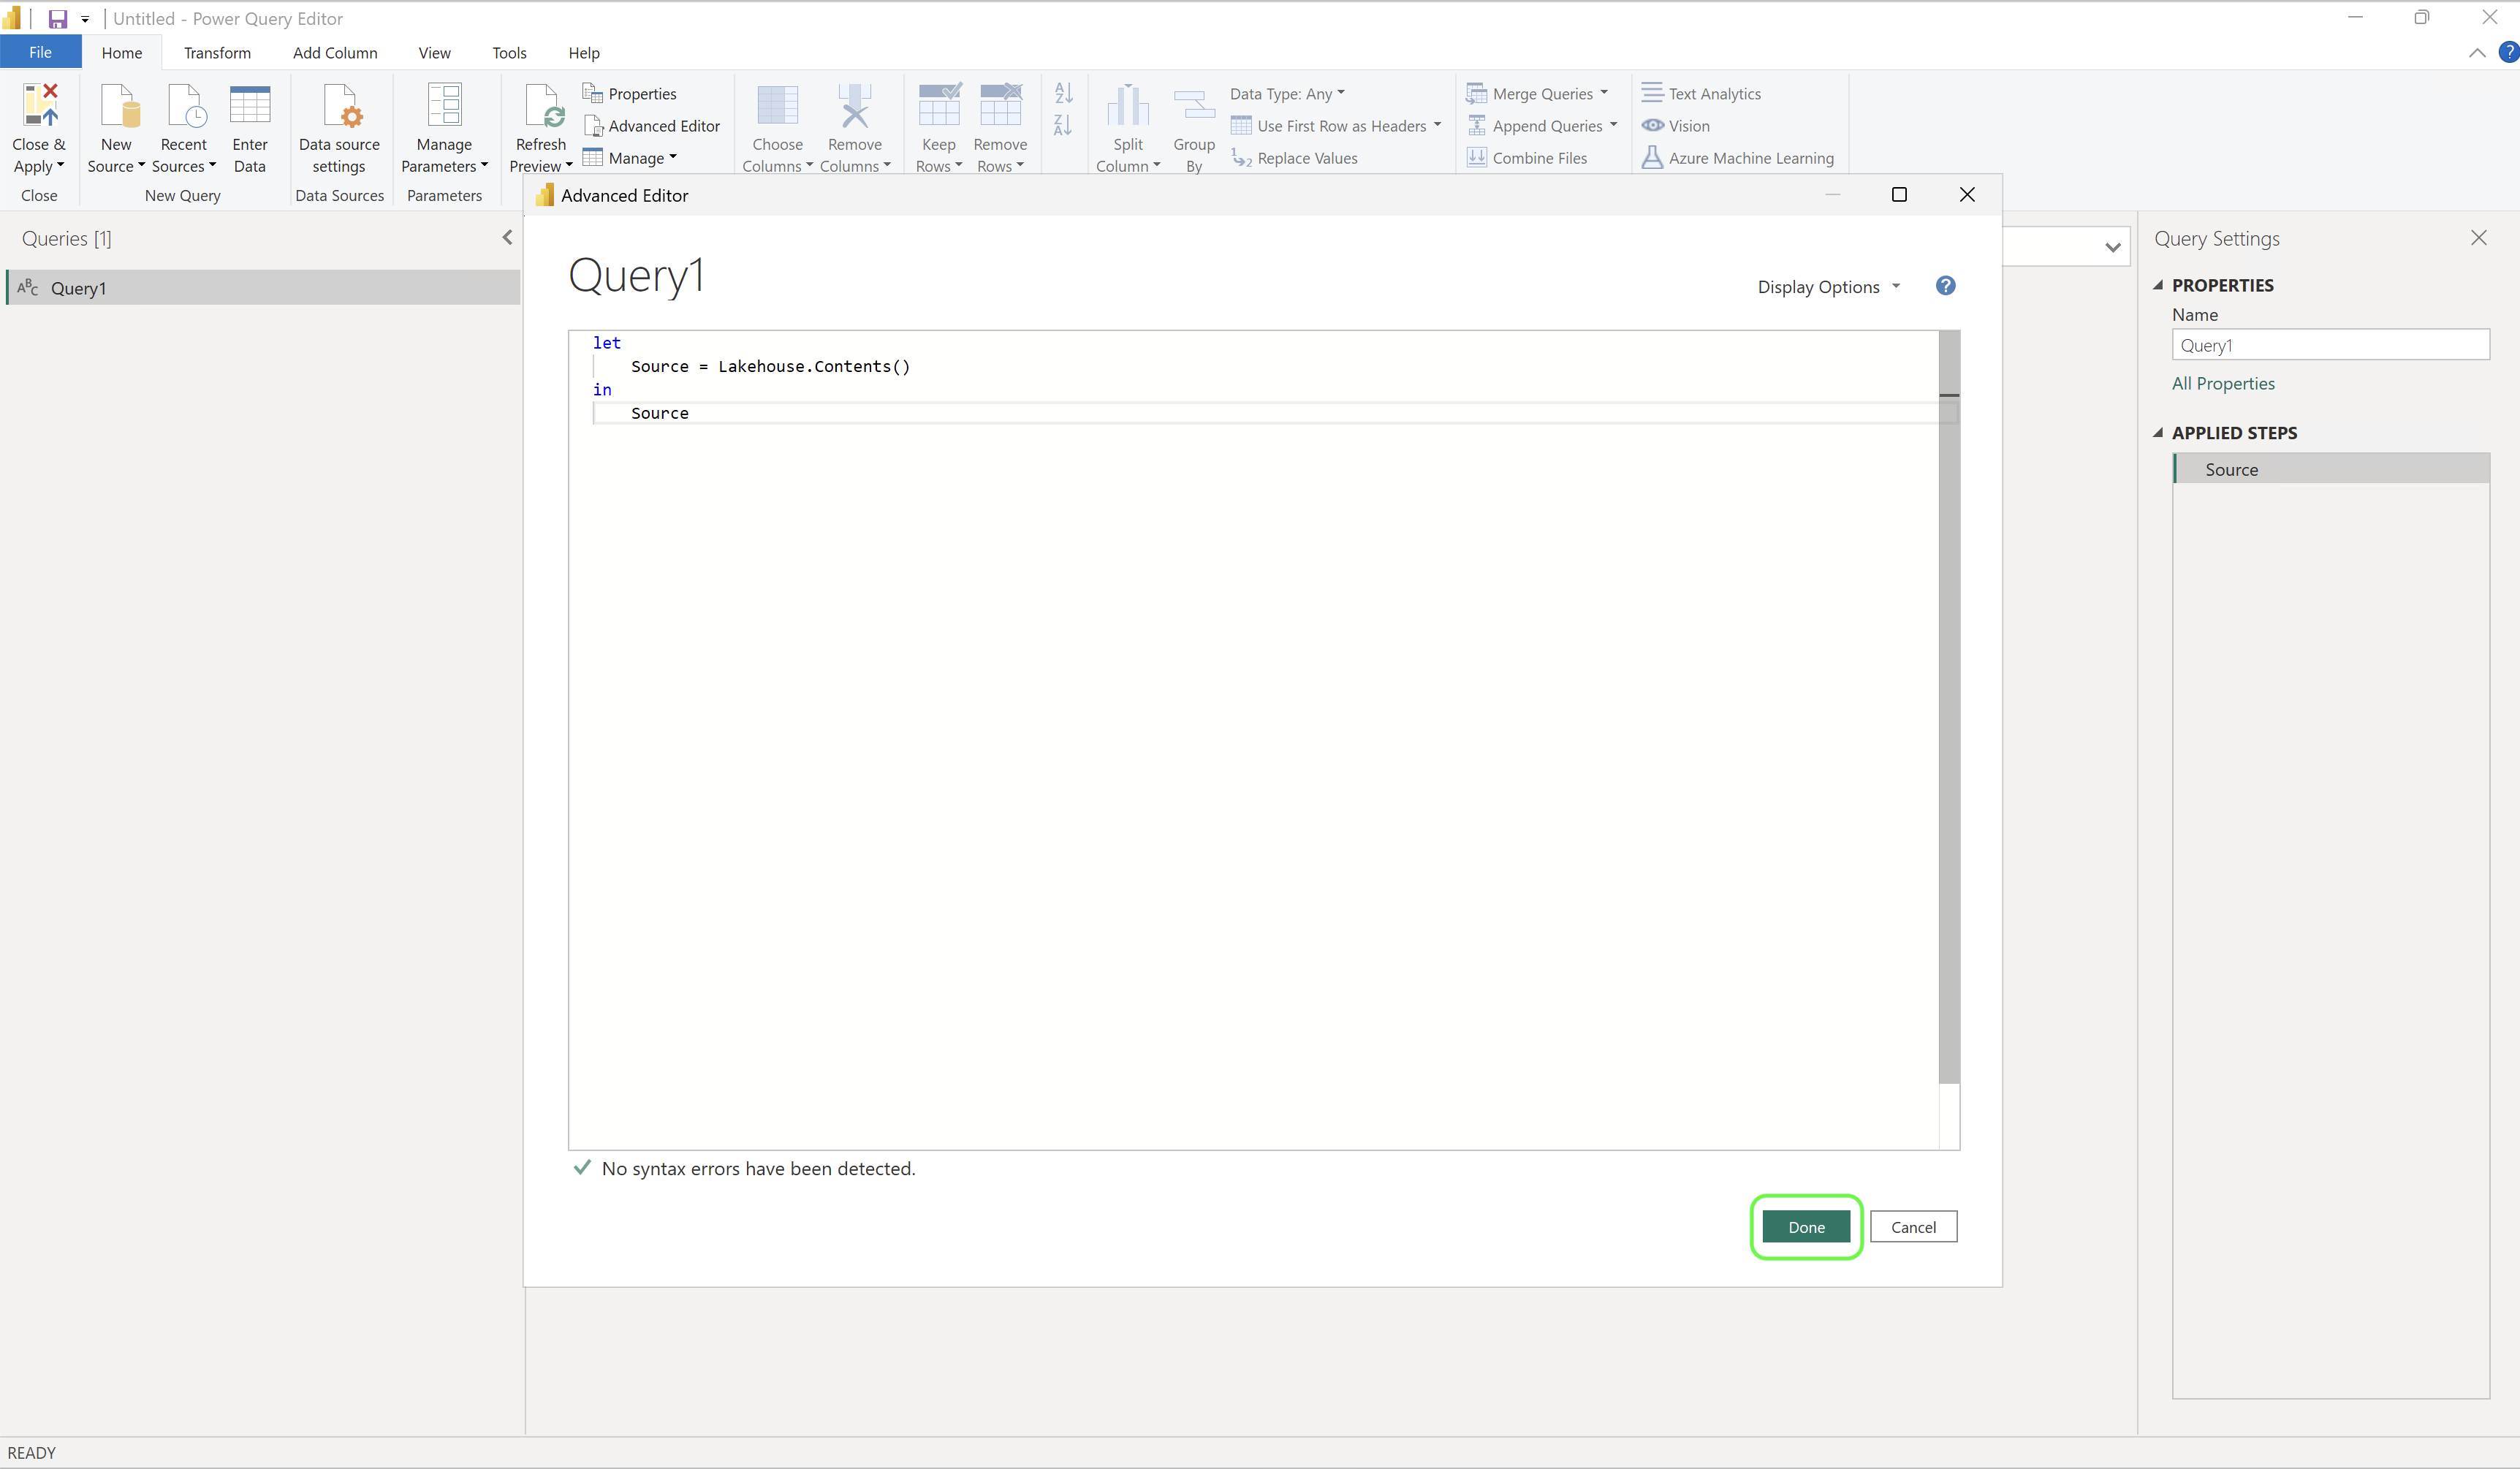
- Enter the following M code to connect to your lakehouse:
let
    Source = Lakehouse.Contents()
in
Source- Click “Done” to execute the query and establish the connection to your lakehouse.
Step 4: Authenticate to Your Lakehouse


When connecting to your lakehouse, you’ll need to authenticate:
- You’ll see a message asking you to specify how to connect. Click “Edit Credentials.”
- In the authentication dialog, select “Organizational account.”
- Click “Sign in” to authenticate with your Microsoft account.
- Once authenticated, click “Connect” to proceed.
Step 5: Navigate to Your Files

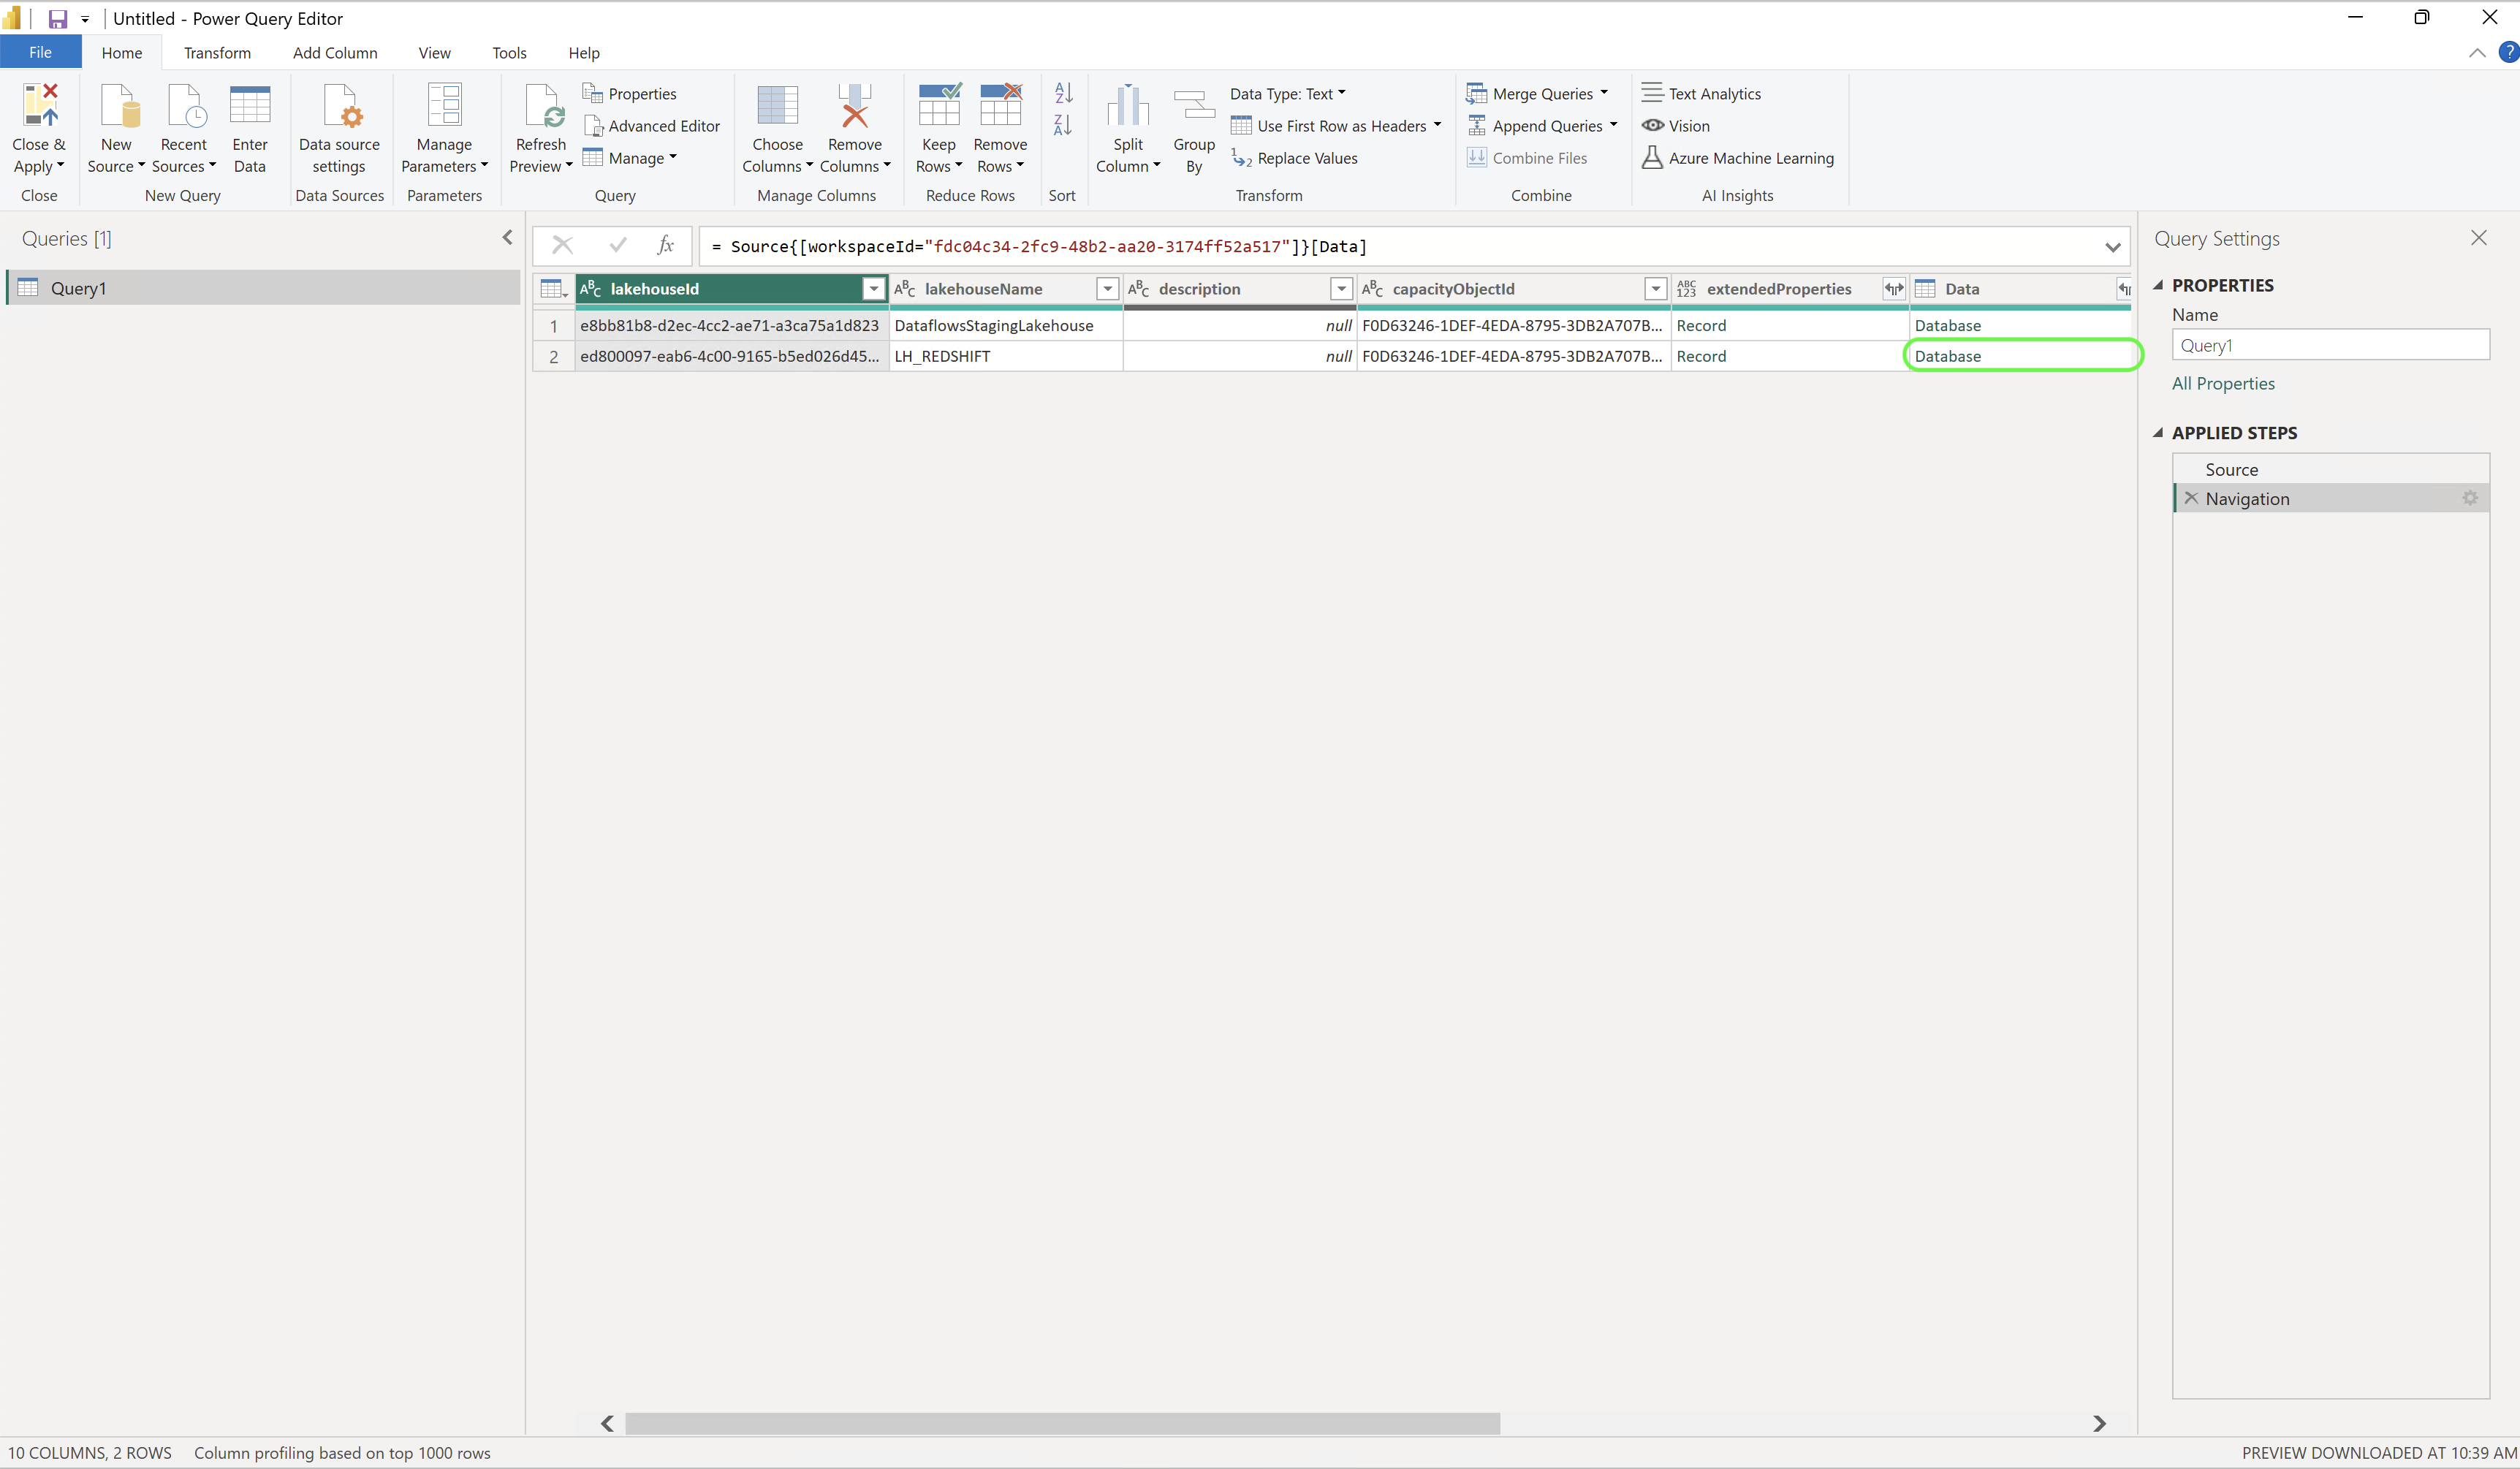
After connecting to your lakehouse, you’ll see a list of available workspaces:
- Navigate through the folder structure to find your workspace.
- Select the appropriate lakehouse from the list.
- You’ll see the lakehouse contents, including any database tables and the “Files” folder.
- Click on “Files” to access your uploaded files.
Step 6: Locate and Select Your Excel or CSV Files


With access to the “Files” folder:
- Navigate through the folder structure to find your Excel or CSV files.
- In our example, we navigate to the “sample_datasets” folder, which contains several CSV files.
- Select the CSV file you want to work with, such as “city_safety_seattle.csv” or any other file in your lakehouse.
Step 7: Transform and Load the Data
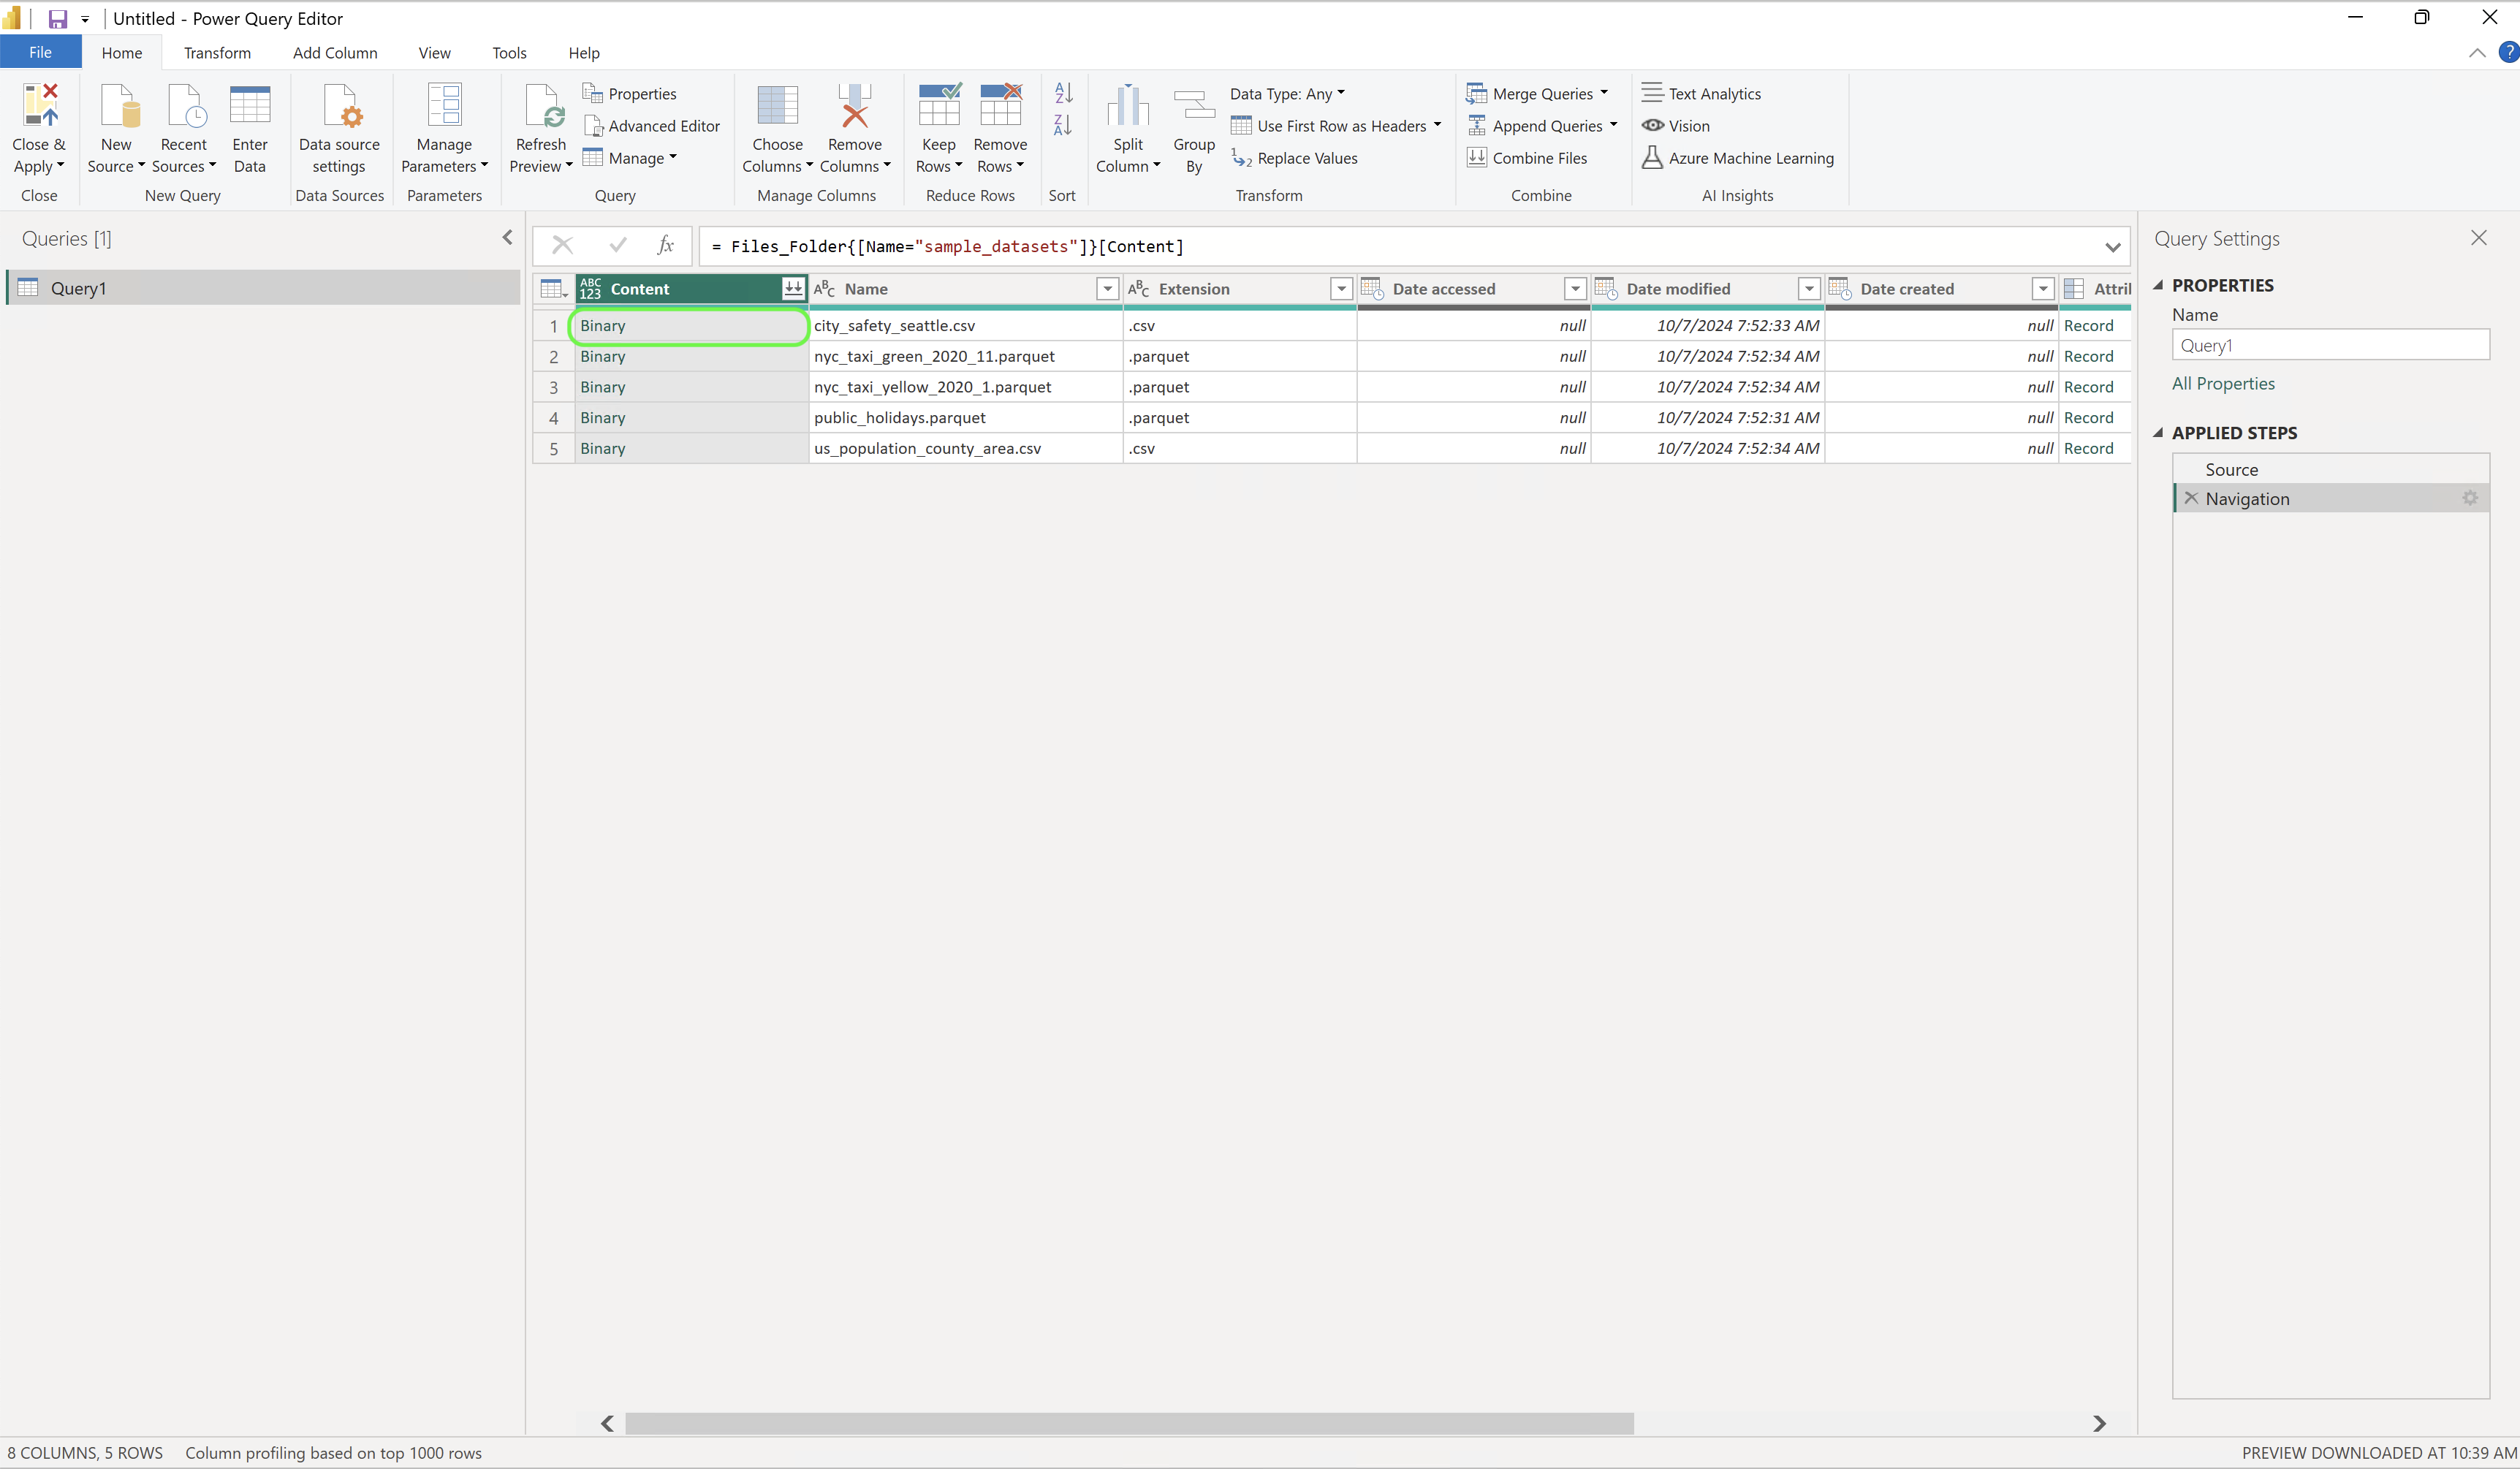

Once you’ve selected your file:
- Power BI will automatically load and display a preview of the data.
- You can now use Power Query’s transformation tools to clean and prepare your data:
- Promote headers if needed
- Change column data types
- Remove unnecessary columns
- Filter rows
- Create calculated columns
- After making your transformations, click “Close & Apply” to load the data into your Power BI model.
- Remember to give your tables and columns meaningful names for better usability.
Step 8: Create Visualizations With Your Data
Now that your data is loaded into Power BI:
- You can create visualizations by dragging fields onto the canvas.
- Build charts, tables, maps, and other visuals to analyze your data.
- Create relationships between multiple datasets if needed.
- Design interactive dashboards with slicers and filters.
Conclusion
Connecting to Excel and CSV files stored in your Microsoft Fabric lakehouse from Power BI provides a seamless experience for data analysis and visualization. This integration eliminates the need to download files locally before analysis and allows you to work directly with the data in the cloud. The power of this approach lies in its ability to combine the data storage capabilities of the lakehouse with the robust visualization tools of Power BI.
By following the steps outlined in this blog post, you can efficiently access, transform, and visualize data from your lakehouse, enabling better insights and decision-making. This workflow is particularly valuable for organizations that have adopted Microsoft Fabric as their data platform, as it streamlines the analytics process and promotes a more integrated data ecosystem.
Remember to name your tables and columns appropriately to make your data model more intuitive and user-friendly. This simple practice can significantly improve the usability of your reports and dashboards.

